“Nowcasting the BOJ’s Core-Core Inflation Rate Based on the Nikkei CPINow-S”
January 26, 2016

Tsutomu Watanabe
Nowcast Inc & University of Tokyo
A replica of the official CPI
Nowcast Inc. released on January 20 the recent figure for the Nikkei CPINow- S, which can be regarded as a replica of the official CPI in the sense that the estimation method employed, including product sampling, aggregation, and quality adjustment, is the same as the one employed by the Statistics Bureau of Japan (SBJ). The only difference between the two is that price observations used in the official CPI is collected by price collectors employed by the SBJ, while the Nikkei CPINow-S is constructed using scanner data collected from about 800 supermarket stores. The Y/Y inflation rate for the S index was 2.2 percent for January 2016, which is slightly lower than for December 2015 (The Y/Y rate for December 2015 was 2.6 percent). See Figure 1 for the inflation rate based on the S index.
The S index consists of 137 items, while the official CPI consists of 588 items. In terms of CPI weights, the S index covers 12.3 percent, which is obviously not so high. Therefore, we cannot expect one-to-one relationship between the S index and the official CPI. However, we can still learn something about the CPI from the S index, so the question to be asked is how much one can learn from the S index. To address this question, we investigate in this report the relationship between the rate of inflation for the S index and the official CPI inflation rate. Specifically, we focus on the BOJ’s core-core CPI inflation rate, which is defined as CPI less fresh food and energy, and look at the correlation between this and the inflation rate based on the S index, thereby evaluating how useful the S index is in predicting the BOJ core-core inflation rate. Note that the BOJ core-core index consists of 519 items with the CPI coverage at 88.3 percent, and that the S index is a subset of the BOJ core-core index.
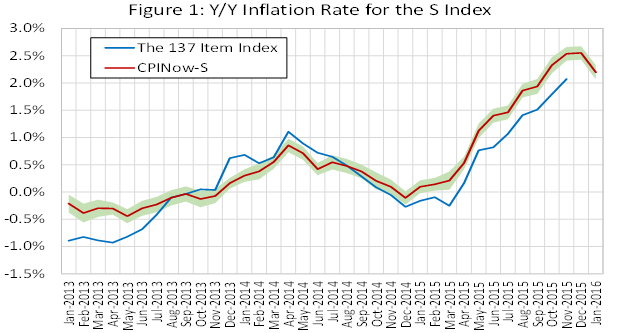
Source: Nowcast, Statistics Bureau of Japan
Comparison of the BOJ core-core index and the S index
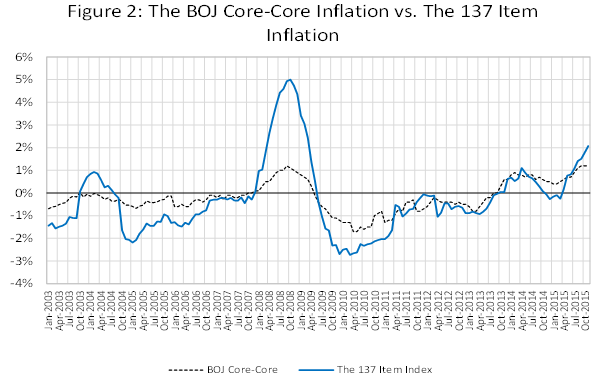
Let us start by simply comparing the two time series. Figure 2 shows the BOJ core –core inflation rate and the rate of inflation constructed from the 137 items included in the S index, which we refer to as “the 137 item index” in this report. We can immediately see that the 137 item index shows larger amplitude than the BOJ core-core index. This is probably because the 137 item index mainly consists of food items with relatively flexible prices, while the BOJ core-core contains a number of items with sticky prices, especially in the service sector.
However, the figure shows that peaks and troughs in the two series are almost the same. For example, the BOJ core-core inflation rate fluctuated during the period of Abenomics in the following way; it started to increase in the spring of 2013, when the QQE was started by the BOJ. However, it turned to negative again in April 2014 when the consumption tax rate was raised. More recently, it turned to positive again in March 2015, partly due to the yen depreciation associated with the additional monetary stimulus by the BOJ in October 2014. The rate of inflation for the 137 item index showed a similar fluctuation with only a few month lag.
Regression Analysis
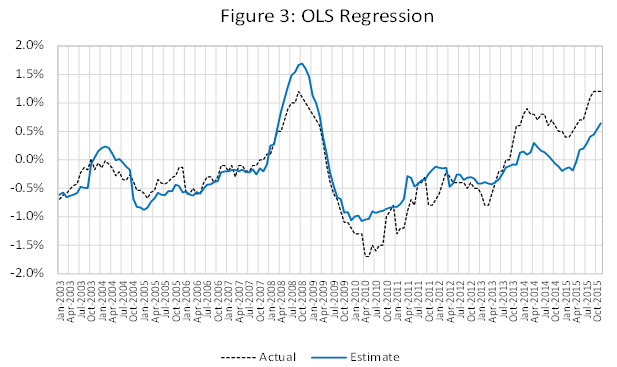
As a next step, we conduct regression analysis. The first thing we do is to run a simple OLS regression with the BOJ core-core inflation rate as a dependent variable and the inflation rate for the 137 item index as an independent variable. The coefficient associated with the 137 item inflation rate is 0.36 (with a constant term at -0.001), implying that the BOJ core-core inflation rate changes by 0.36 percentage point when the 137 item inflation rate changes by one percent. Note that the 137 item index accounts for only 14 percent of the BOJ core-core index, so that a direct impact of one percentage change in the 137 item index on the BOJ core-core is only 0.14 percent. This means that prices for other items in the BOJ core-core than the 137 items are closely correlated with the 137 item index.
The regression result is presented in Figure 3. The performance of this simple regression is not that bad, although estimation errors tend to be greater in the latter half of the sample period. Specifically, we see tendency of over-estimation in 2010-2011, while under-estimation in 2013-2015. It seems that the responsiveness of the BOJ core-core to the 137 item index has increased in the latter half of the sample period, leading to such estimation errors.
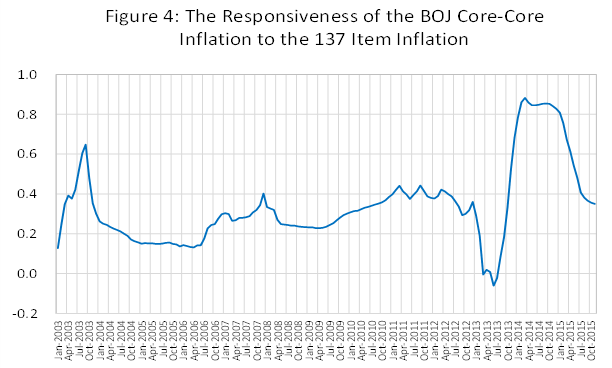
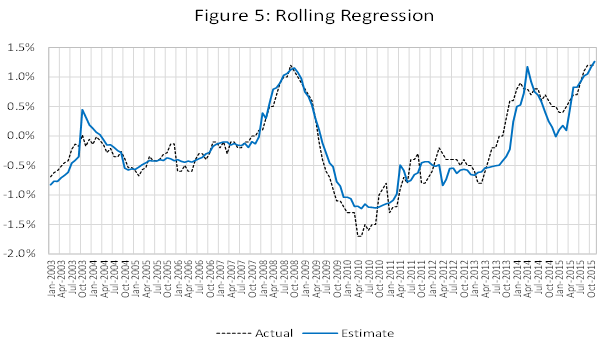
To take this change in the responsiveness into account, we run a rolling regression with the window size set at 24 months. The estimated coefficient on the 137 item inflation rate is shown in Figure 4, suggesting that the BOJ core-core became more responsive to the 137 item index in 2013-2015. Figure 5 shows the regression result. We see that the fitting in the latter half of the sample period is now much better than before.
Nowcasting the BOJ core-core
The two regression exercises we conducted are quite simple and there remains room for improvement in various respects. For example, we may think about adding dependent variables in addition to the 137 item index, or we may employ more careful estimation methodologies like time variant parameter techniques. We do not argue that this is the best way to predict the BOJ core-core inflation. However, it should be emphasized that the simple regressions we conducted perform relatively well, as shown in Figures 3 and 5, suggesting that the extent to which we can learn from the 137 item index about the BOJ core-core index is not trivial.
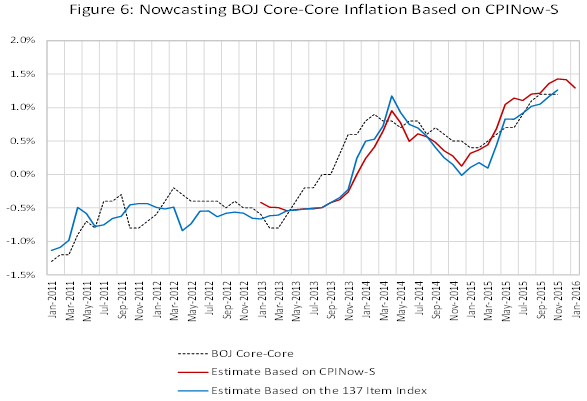
Based on this understanding, we make prediction for the BOJ core-core inflation rate for December 2015 and January 2016 from the inflation rate for the S index released by Nowcast Inc. on January 20, 2016. Our prediction is based on the estimation result for the rolling regression with the coefficient of the responsiveness at 0.35, which is taken from the final month of the sample period. The red line in Figure 6 shows the prediction for the BOJ core-core inflation rate. It indicates that the BOJ core-core inflation rate in December 2015 will be almost the same as that in November 2015, but it will be lower in January 2016 than in the previous month by 0.13 percentage point. The BOJ core-core inflation rate, which has been rising since March 2015, seems to be at a turning point. Also, it should be noted that our T-index, which is a successor to the UTokyo Daily Price Index, has started to show a slower growth since the very end of last December.
Source: Bank of Japan, Statistics Bureau of Japan
表1 S指数前年比の変化方向は日銀版コアコア前年比の変化方向と同じか?

Source: Bank of Japan, Statistics Bureau of Japan
Source: Bank of Japan, Statistics Bureau of Japan
Source: Bank of Japan, Statistics Bureau of Japan
Source: Bank of Japan, Statistics Bureau of Japan
Source: Nowcast, Bank of Japan, Statistics Bureau of Japan
Tsutomu Watanabe
Nowcast Inc & University of Tokyo